| SCROLL to read The CNBC Current Events Article (August 6, 2021 8:00 am ET) |
Current Event -- FULL EMPLOYMENT (August 7, 2021)
- - - - - - - - - - - - - - - - - - - - - - - - - - - - - - - - - - - - - - - - - - - - - - - - - -
On the graph below, the red shaded area represents when a Republican President was in office and the blue shaded area represents when a
Democratic President was or is in office. The grey areas represent a recession as determined by the National Bureau of Economics Research.
Democratic President was or is in office. The grey areas represent a recession as determined by the National Bureau of Economics Research.
| IMPORTANT NOTE: Starting with the July, 2021 report: An Update to the Budget and Economic Outlook: 2021 to 2031, this series was renamed from "Natural Rate of Unemployment (Long-Term)" to "Noncyclical Rate of Unemployment". |
On the graph below, you will see two unemployment rates:
1) The Actual Rate of Unemployment (determined by U3--the unemployment rate that represents the number of unemployed
as a percentage of the labor force)
1) The Actual Rate of Unemployment (determined by U3--the unemployment rate that represents the number of unemployed
as a percentage of the labor force)
2) The Noncyclical Rate of Unemployment (formerly known as the Natural Rate of Unemployment -- the long-run rate of unemployment)
Notice on the graph below, the Noncyclical Rate of Unemployment (long-term rate) has been decreasing since 1978 (6.2%)
to 2021 (5.4% as of July 2021).
On a sidebar I started teaching economics in 1978, so the main reason for the long-run unemployment rate decreasing ever since is
because of my teachings. Just joking. I just want to make sure you remember the term "post hoc fallacy" (a cause and effect fallacy)
you learned in chapter 1.
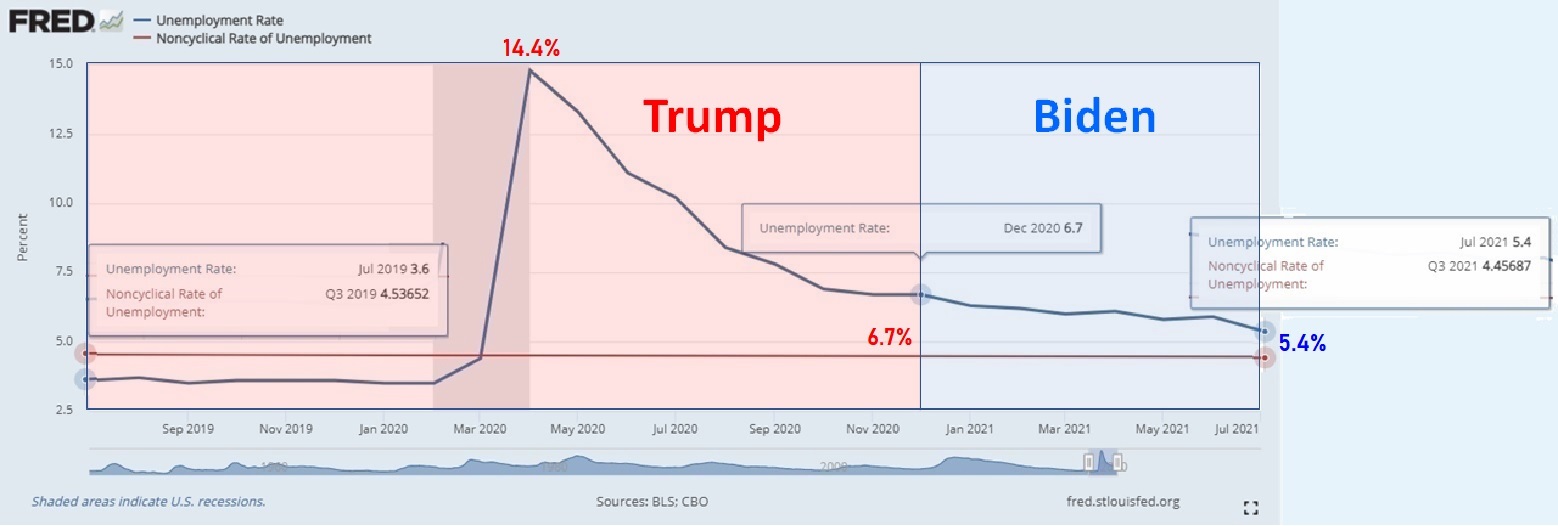
Whether or not you like the former or current administration, notice on the graph above the unemployment numbers
for U3 (the stated unemployment rate you find in the news) has moved from a high of 14.4% to 5.4%. The most
important information you can gather from the graph above is the actual unemployment rate has been moving in the
right direction.
Remember government is only a part of macroeconomics. According the Bureau of Labor Statistics (BLS), the
2nd quarter of 2021, it is estimated that over 86% of the U.S. economy's real GDP is driven by the private sector --
households and firms. With that being said, the U.S. government debt has gone from $23,200,000,000,000 (March
2020) in response to the U.S. COVID19 pandemic to $27,700,000,000,000 (December 2020) less than a month before
Donald Trump left office, an increase in the federal government debt of $4.5 trillion. Under President Biden's
leadership, the U.S. Government debt has also climbed. As this lesson is being written on August 7, 2021,
Congress is looking to pass an additional $1,200,000,000,000 infrastructure bill which most economists expect
to bring down the unemployment rate as construction jobs and its multiplier effect begin to take hold. To what
extent it goes down is based upon this and many other factors, such as COVID 19 Delta variant getting under control,
government policies, changes in technology and productivity, global wars, and so on.
Proposed Financing Sources for New Investment
Reduce the IRS tax gap
Unemployment insurance program integrity
Redirect unused unemployment insurance relief funds
Repurpose unused relief funds from 2020 emergency relief legislation
State and local investment in broadband infrastructure
Allow states to sell or purchase unused toll credits for infrastructure
Extend expiring customs user fees
Reinstate Superfund fees for chemicals
5G spectrum auction proceeds
Extend mandatory sequester
Strategic petroleum reserve sale
Public-private partnerships, private activity bonds, direct pay bonds and asset recycling
for infrastructure investment
Macroeconomic impact of infrastructure investment
The White House published this information on June 24, 2021:
The Framework, which will generate significant economic benefits and returns, is financed through a combination of closing
the tax gap, redirecting unspent emergency relief funds, targeted corporate user fees, and the macroeconomic impact of
infrastructure investment.
The Framework, which will generate significant economic benefits and returns, is financed through a combination of closing
the tax gap, redirecting unspent emergency relief funds, targeted corporate user fees, and the macroeconomic impact of
infrastructure investment.
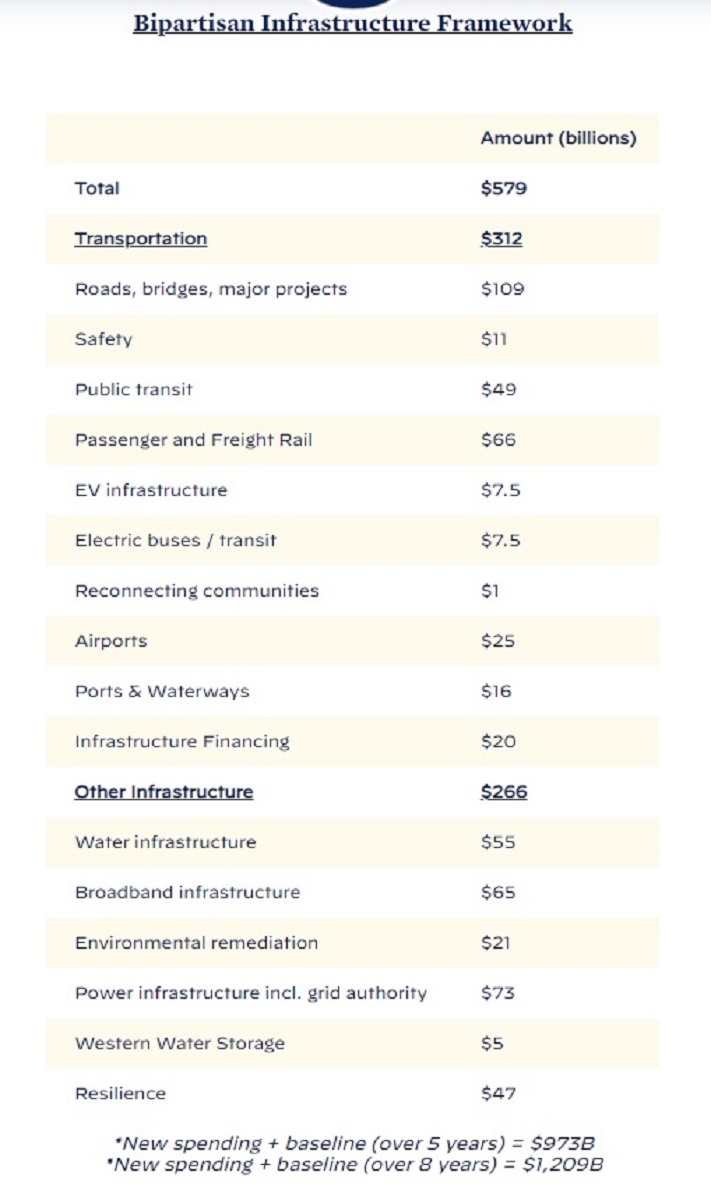
Proposed Infrastructure Spending
Answer to first graph in this lesson:
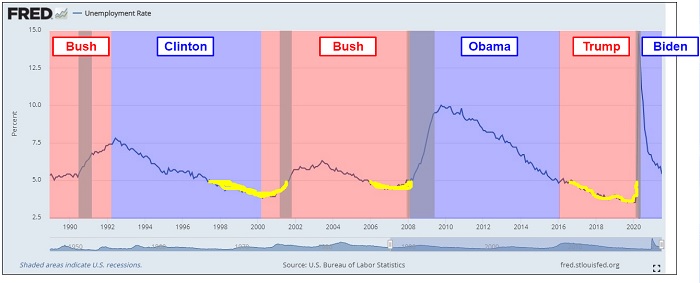
1) Type inside the input text boxes below the last names of the Presidents from 1990 to 2021.
2) Using your cursor or finger to draw ALONG the unemployment line where unemployment is 5% OR LESS. This is near where the
economy is considered to be AT FULL EMPLOYMENT.
2) Using your cursor or finger to draw ALONG the unemployment line where unemployment is 5% OR LESS. This is near where the
economy is considered to be AT FULL EMPLOYMENT.
| NOTE: Look at how short-lived the COVID 19 recession has been relative to the lengths of other recessions. It lasted only three months from March 2020 - May 2020. |
- - - - - - - - - - - - - - - - - - - - - - - - - - - - - - - - - - - - - - - - - - - - - - - - - -
- - - - - - - - - - - - - - - - - - - - - - - - - - - - - - - - - - - - - - - - - - - - - - - - - -
- - - - - - - - - - - - - - - - - - - - - - - - - - - - - - - - - - - - - - - - - - - - - - - - - -