In this unit, Debt and Deficit, you will learn about the following:
*What is the definition of debt?
*What is the definition of government debt?
*What is the current U.S. Government debt?
*To whom is the U.S. Government debt owed?
*Who pays for the U.S. Government debt?
*What is the definition of deficit?
*What is the definition of surplus?
*What is the difference between discretionary and non-discretionary spending?
*What is the definition of debt?
*What is the definition of government debt?
*What is the current U.S. Government debt?
*To whom is the U.S. Government debt owed?
*Who pays for the U.S. Government debt?
*What is the definition of deficit?
*What is the definition of surplus?
*What is the difference between discretionary and non-discretionary spending?
Review:
In this unit, Debt and Deficit, you learned about the following:
*The Running Debt Clock
*What is the definition of debt?
*What is the definition of government debt?
*What is the current U.S. Government debt?
*To whom is the U.S. Government debt owed?
*Who pays for the U.S. Government debt?
*What is the definition of deficit?
*What is the definition of deficit?
*What is the definition of surplus?
*What is the difference between discretionary and non-discretionary spending?
In this unit, Debt and Deficit, you learned about the following:
*The Running Debt Clock
*What is the definition of debt?
*What is the definition of government debt?
*What is the current U.S. Government debt?
*To whom is the U.S. Government debt owed?
*Who pays for the U.S. Government debt?
*What is the definition of deficit?
*What is the definition of deficit?
*What is the definition of surplus?
*What is the difference between discretionary and non-discretionary spending?
Get ready for this next debt clock shown below. It will not only show the current U.S.
National Debt, shown in the upper left hand corner of the clock, but it will also give you
a plethora of different clocks on a variety of economic topics to peruse.
National Debt, shown in the upper left hand corner of the clock, but it will also give you
a plethora of different clocks on a variety of economic topics to peruse.
What is the definition of debt?
Debt is the total amount owed. If you have a mortgage on a home, you owe
the lender until the mortgage is paid off. If you have a car loan, you owe the
bank until the car is paid off. If you have credit card debt, you owe the credit
card company until the credit card balance is paid off. If these are your debts,
then the total debt you owe is the accumulation of your mortgage debt, car
debt, and credit card debt.
What is the definition of government debt?
Government debt is the total amount owed to its lenders. To pay for this debt
the government issues IOUs designated as T-bills, T-notes, and T-bonds (the
"T" stands for Treasury). This will be discussed in a future lesson.
Debt is the total amount owed. If you have a mortgage on a home, you owe
the lender until the mortgage is paid off. If you have a car loan, you owe the
bank until the car is paid off. If you have credit card debt, you owe the credit
card company until the credit card balance is paid off. If these are your debts,
then the total debt you owe is the accumulation of your mortgage debt, car
debt, and credit card debt.
What is the definition of government debt?
Government debt is the total amount owed to its lenders. To pay for this debt
the government issues IOUs designated as T-bills, T-notes, and T-bonds (the
"T" stands for Treasury). This will be discussed in a future lesson.
What are the definitions of deficit and surplus?
What is the difference between Mandatory Spending and Discretionary Spending?
To whom is the U.S. Government debt owed?
Many uninformed citizens think almost all of the debt is owed to foreign
countries (citizens, firms, or governments), but this is not the case. Looking at
the pie chart below, you can see most of the U.S. Government debt is owed to
U.S. citizens, firms, the Federal Reserve, and the U.S. Government itself.
Many uninformed citizens think almost all of the debt is owed to foreign
countries (citizens, firms, or governments), but this is not the case. Looking at
the pie chart below, you can see most of the U.S. Government debt is owed to
U.S. citizens, firms, the Federal Reserve, and the U.S. Government itself.
DEBT:
DEFICIT:
On the daily interactive chart below, you will see many interesting numbers
changing before you eyes, but at this point in time, pay particular attention to
the U.S. Debt and notice that the U.S. Debt increases by $1,000,000 in just
15 seconds. So, that means the U.S. Debt climbs by $4,000,000 every single
minute.
Realize this doesn't mean how fast the government is spending money. This is
how much the federal government is OVERspending money within a minute.
changing before you eyes, but at this point in time, pay particular attention to
the U.S. Debt and notice that the U.S. Debt increases by $1,000,000 in just
15 seconds. So, that means the U.S. Debt climbs by $4,000,000 every single
minute.
Realize this doesn't mean how fast the government is spending money. This is
how much the federal government is OVERspending money within a minute.
Who pays for the U.S. Government debt?
The U.S. Government issues IOUs through the U.S. Treasury in the form of T-Notes
(maturity date of less than one year), T-Bills (maturity date anywhere from one year
to ten years), and T-Bonds (maturity date anywhere from 10 years to 30 years).
These securities pay interest so they become an investment vehicle for savers.
Looking at the pie chart below, you can see the breakdown on whom the
U.S. Government debt is owed.
The U.S. Government issues IOUs through the U.S. Treasury in the form of T-Notes
(maturity date of less than one year), T-Bills (maturity date anywhere from one year
to ten years), and T-Bonds (maturity date anywhere from 10 years to 30 years).
These securities pay interest so they become an investment vehicle for savers.
Looking at the pie chart below, you can see the breakdown on whom the
U.S. Government debt is owed.
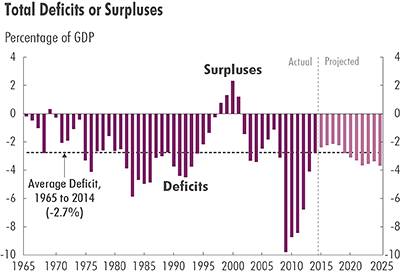
A deficit is when an entity over spends what it brings in with
revenue in one year. Let's say you bring in $50,000 in a year
and spend $60,000 in that year, you are running a deficit of
$10,000. Businesses call this operating in the RED. The U.S.
Government calls this "running a deficit."
A surplus is when an entity brings in more revenue than
what it spends in a year. Let's say you bring in $50,000 in a
year and spend $40,000 in that year, you are running a
surplus of $10,000. Businesses call this operating in the
BLACK. The U.S. Government calls this "running a surplus."
Notice on the graph to the left, the U.S. Government has
mostly been running deficits, other than the four years from
1998 - 2001 where it ran surpluses.
revenue in one year. Let's say you bring in $50,000 in a year
and spend $60,000 in that year, you are running a deficit of
$10,000. Businesses call this operating in the RED. The U.S.
Government calls this "running a deficit."
A surplus is when an entity brings in more revenue than
what it spends in a year. Let's say you bring in $50,000 in a
year and spend $40,000 in that year, you are running a
surplus of $10,000. Businesses call this operating in the
BLACK. The U.S. Government calls this "running a surplus."
Notice on the graph to the left, the U.S. Government has
mostly been running deficits, other than the four years from
1998 - 2001 where it ran surpluses.
You are going to be looking at three pie charts down the left side.
A) Mandatory Spending
B) Discretionary Spending
C) Total U.S. Government Spending (Mandatory Spending
+ Discretionary Spending)
A) Mandatory Spending is spending that Congress cannot
change unless it changes the law. Notice mandatory spending
includes: Social Security, Medicare, Health, and Income Security.
This amount of spending changes based upon the number of
individuals either entering or exiting that category based upon
age, health, or means. The
other mandatory spending is the net interest on the debt.
If interest rates remain constant and the debt keeps rising, then
the yearly net interest on the debt rises, and visa versa.
If the debt remains constant and interest rates are rising, then
the net interest on the debt rises, and visa versa.
A) Mandatory Spending
B) Discretionary Spending
C) Total U.S. Government Spending (Mandatory Spending
+ Discretionary Spending)
A) Mandatory Spending is spending that Congress cannot
change unless it changes the law. Notice mandatory spending
includes: Social Security, Medicare, Health, and Income Security.
This amount of spending changes based upon the number of
individuals either entering or exiting that category based upon
age, health, or means. The
other mandatory spending is the net interest on the debt.
If interest rates remain constant and the debt keeps rising, then
the yearly net interest on the debt rises, and visa versa.
If the debt remains constant and interest rates are rising, then
the net interest on the debt rises, and visa versa.
B) Discretionary Spending is spending that Congress has
some discretion (control) over how money is spent. When
you see debates in Congress on spending issues by the
U.S. Government, most of these debates are over
discretionary spending.
Whenever you read about sequestration (automatic
spending cuts), it relates to discretionary spending and
not mandatory spending. Notice that National Defense is
by far the largest percentage of discretionary spending.
It is though, only the second largest spending by the U.S.
Government, as Social Security payments took over
National Defense as the number one largest expenditure
back in 1992.
some discretion (control) over how money is spent. When
you see debates in Congress on spending issues by the
U.S. Government, most of these debates are over
discretionary spending.
Whenever you read about sequestration (automatic
spending cuts), it relates to discretionary spending and
not mandatory spending. Notice that National Defense is
by far the largest percentage of discretionary spending.
It is though, only the second largest spending by the U.S.
Government, as Social Security payments took over
National Defense as the number one largest expenditure
back in 1992.
C) Total Government Spending is spending both
mandatory pending + discretionary spending.
Notice on the pie graph to the left that other than National
Defense (by far the largest portion of discretionary
spending), most of government spending is mandatory
spending (Social Security, Income Security, Medicare,
Health, and Net Interest on Debt).
mandatory pending + discretionary spending.
Notice on the pie graph to the left that other than National
Defense (by far the largest portion of discretionary
spending), most of government spending is mandatory
spending (Social Security, Income Security, Medicare,
Health, and Net Interest on Debt).
Debt vs. Deficit (3:06 minutes)
Reffonomics.com 3 x 3 Videos (3-minute videos + 3 Multiple Choice Questions)
Congress and the President (2:30 minutes)
Fiscal Policy--Personal Income Taxes (3:15 minutes)
Fiscal Policy--Business Taxes (2:30 minutes)
Fiscal Policy--Government Spending (2:52 minutes)
DEBT and DEFICIT

| Steven M. Reff Economics Lecturer University of Arizona (2007 - 2016) The 2015 University of Arizona Five-Star Faculty Award |
- - - - - - - - - - - - - - - - - - - - - - - - - - - - - - - - - - - - - - - - - - - - - - - - - - - - - - - - - -
Notice on the INTERACTIVE graph to the left, as the U.S.
Government keeps running deficits, the debt continues to
climb. Even when the U.S. Government was running surpluses,
it did not use all of the surpluses to pay down its debt.
Let's say you bring in $50,000 and spend $40,000 and don't
use the surplus of $10,000 to pay down debt, but instead
increase spending by $10,000, then the debt (total amount owed)
does not change. Basically, This is why during the years of
surpluses (1998 - 2001), you don't see much of a change in the
debt.
Government keeps running deficits, the debt continues to
climb. Even when the U.S. Government was running surpluses,
it did not use all of the surpluses to pay down its debt.
Let's say you bring in $50,000 and spend $40,000 and don't
use the surplus of $10,000 to pay down debt, but instead
increase spending by $10,000, then the debt (total amount owed)
does not change. Basically, This is why during the years of
surpluses (1998 - 2001), you don't see much of a change in the
debt.