The Federal Reserve System and its Dual Mandate
In this lesson on Federal Reserve System, you will learn the following concepts:
*What is price stability?
*What is maximum employment?
*What is the Dual Mandate and what does it mean for the economy?
*What is price stability?
*What is maximum employment?
*What is the Dual Mandate and what does it mean for the economy?

| Steven M. Reff Economics Lecturer University of Arizona (2007 - 2016) The 2015 University of Arizona Five-Star Faculty Award |
- - - - - - - - - - - - - - - - - - - - - - - - - - - - - - - - - - - - - - - - - - - - - - - - - - - - - - - - - - - - - - - - - -
| What is meant by the term price stability? |
"Price stability refers to a situation where there is a low and stable rate of inflation over an extended period,
avoiding significant fluctuations in the general price level of goods and services. It is a key goal of economic
policy, such as the monetary policy of the U.S. Federal Reserve, which has set a 2% annual inflation target."
-- Google AI --
Stated in simpler terms, former Fed Chair Alan Greenspan (1987 - 2006), described price stability as a
situation where inflation is at a low and stable level so that businesses and households don’t think about
inflation in their decisions.
NOTE: Price level is the overall average cost of all goods and services in an economy at one time, while
inflation is the rate at which this price level increases over a period of time. Price Level has a tendency to be
"sticky" downward. Once the price level goes up, the price level has a propensity (tendency) not to go down
or goes down slowly. When an economy starts to slow down, prices (and wages) are slow to fall.
Too many voters confuse these two terms -- Price Level and Inflation.
For example, during the Biden Administration, between 2020 - 2024, prices rose cumulatively by 19.3%
(PCE index) or 21.5% (CPI). This cumulative increase in inflation caused the price level to rise. Once the
price level rises, it has a propensity of being sticky downward. A simple illustration is a basket of goods in
2020 that cost $100 in 2020, roughly costs $120 in 2024. In August 2024, the inflation rate stood at 2.4%,
one of the lowest inflation rates during the Biden Administration. Remember, the price level matters most
over time.
During the Trump Administration in 2025, the PCE index stood at 2.6% in August and in September 2.78%.
Looking forward, the Federal Reserves' predictions for inflation using the PCE index (2025 - 2028) are:
2025 inflation between 3.0 - 3.2%; 2026 inflation between 2.5 to 2.7%; 2027 inflation between 2.0 - 2.2%;
2028 inflation could possibly reach the 2.0% inflation rate target inflation rate set by the Fed. Fed website
With all other things held constant, the Fed predicts a cumulative inflation rate of 9.5% at the low end and
10.6% at the high end as it looks into its crystal ball, publishing this information because of the Fed's focus
on forward guidance to help the public understand the workings of the Fed.
| What is meant by the term Maximum Employment? |
Today, many voters think the U.S. Pandemic Recession of 2020 lasted a long time. According to an
August 2024 CNBS article it stated, "Citing higher costs and difficulty making endsmeet, 3 in 5 Americans
falsely believe that the U.S. is currently in a recession, according to a recent report." CNBS
However, according to the National Bureau of Economic Research (NBER), which maintains a chronology
of the beginning and ending dates of US recessions, the U.S. Pandemic Recession lasted only two months --
March and April of 2020. See the thinly shaded gray area on the FRED graph below for 2020.
THE U.S. ECONOMY IS NOT IN A RECESSION AND HAS NOT BEEN IN ONE SINCE 2020!
When you touch the red Non-Cyclical Rate of Unemployment line (the long-run rate of unemployment)
or the black Actual Rate of Unemployment line on the FRED graph below for 2025, you can see that the
U.S. economy is now near the long-run rate of unemployment shown in red.
The Federal Reserve Reform Act of 1977 was passed by Congress to give The Federal Reserve the responsibility
of maintaining: stable prices (inflation), maximum employment (long-run employment), and moderate long-term
interest rates. The reason it is called a Dual Mandate is the Fed has been working on stable prices and maximum
employment and hopefully, this will take care of the third mandate, moderate long-term interest rates.
In January of 2012, the Federal Open Market Committee (FOMC) announced that it believed that
"inflation at the rate of 2 percent, as measured by the annual change in the price index for Personal
Consumption Expenditures, is most consistent over the longer run with the Federal Reserve's statutory
mandate."
When looking at inflation data:
*the Federal Reserve uses the Personal Consumption Expenditures (PCE) Index
*the U.S. Federal Government uses the Consumer Price Index (CPI) (COLAs -- Cost of Living Adjustments).

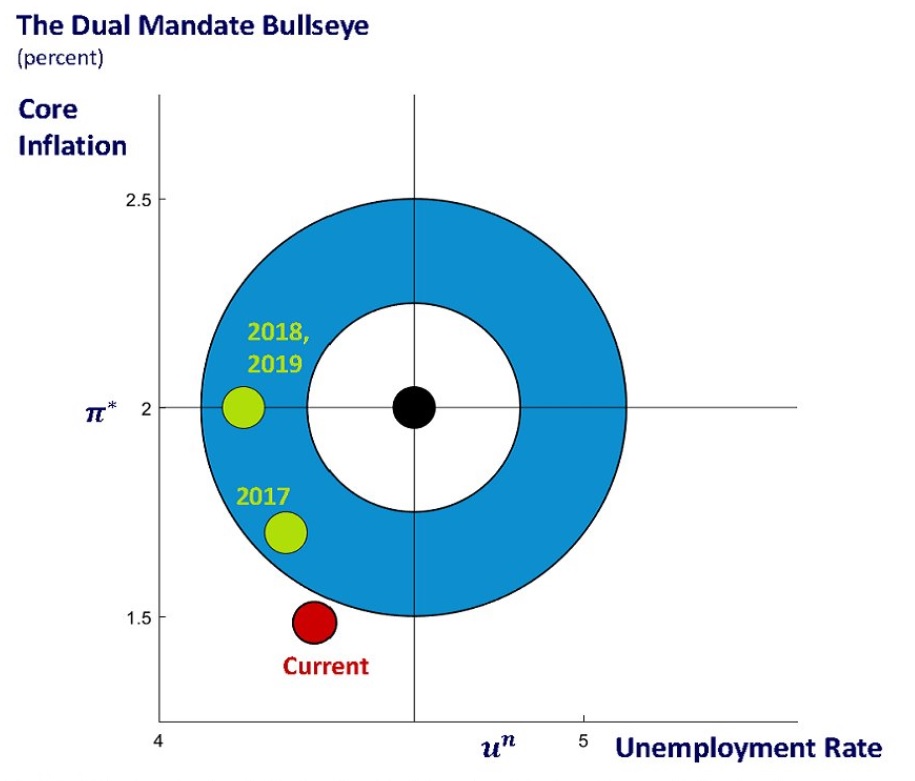
| 2014 |
| 2019 |
Notice the x axis on both graphs is labeled Unemployment (Rate). In 2014, notice the bullseye
unemployment rate was roughly at 5.3% unemployment rate and yet in 2019 the bullseye was roughly
4.5% unemployment rate. If both of these graphs were on a single graph, you would notice that the
bullseye shifted to the left.
Notice the y axis on both graphs are labeled differently (inflation and core inflation). Which one is it?
The Federal Reserve prefers the Personal Consumption Expenditures (PCE) Index, while the Consumer
Price Index (CPI), distributed through the U.S. Federal Government Bureau of Labor Statistics, is the most
commonly cited inflation rate reported by news organizations and other public outlets.
On the interactive Dual Mandate activity below, the inflation rate from the PCE index is used on the y axis.
| What is the Dual Mandate and what does it mean for the economy? |
- - - - - - - - - - - - - - - - - - - - - - - - - - - - - - - - - - - - - - - - - - - - - - - - - - - - - - - - - - - - - - - - - -
- - - - - - - - - - - - - - - - - - - - - - - - - - - - - - - - - - - - - - - - - - - - - - - - - - - - - - - - - - - - - - - - - -
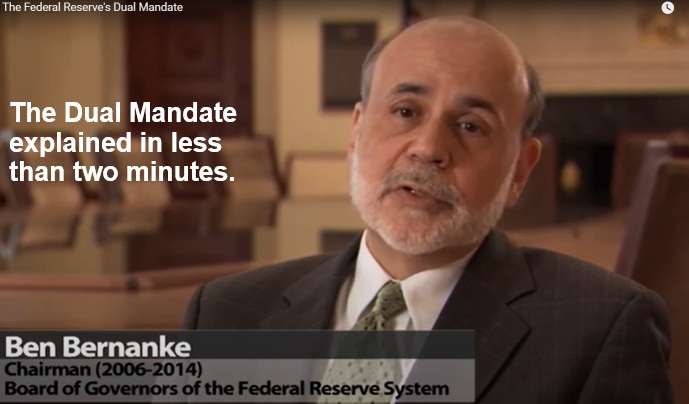
Click on the photo below to watch this 2-minute YouTube
video (1:50 minutes) with Ben Bernanke, former Chairman
of the Federal Reserve (2006 - 2014) explaining the Dual
Mandate of Price Stability and Maximum Employment,
produced by the Federal Reserve Bank of Philadelphia.
Skip the commercial when you can.
video (1:50 minutes) with Ben Bernanke, former Chairman
of the Federal Reserve (2006 - 2014) explaining the Dual
Mandate of Price Stability and Maximum Employment,
produced by the Federal Reserve Bank of Philadelphia.
Skip the commercial when you can.
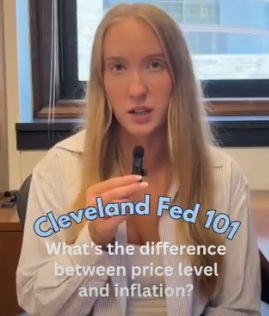
Click on the photo above to
watch this short YouTube video
(3:37 minutes) describing the
difference between price level
and inflation, produced by the
Federal Reserve Bank of
Cleveland.
watch this short YouTube video
(3:37 minutes) describing the
difference between price level
and inflation, produced by the
Federal Reserve Bank of
Cleveland.
| Below is a short slide show using a hot air balloon to describe the difference between price level and inflation. |
| Price Stability and an Inflation Rate of 2%: |
| Maximum Employment -- Forcasted Non-Cyclical Unemployment Rate of 4.3% for 2025 |
| Price Stability -- Fed Target Inflation Rate of 2% |
On the FRED graph below, you will see three lines:
*a dashed green line that represents the 2% target inflation rate the Fed desires.
*a solid green line that represents the Personal Consumption Expenditures Index.
*a solid black line that represents the Consumer Price Index.
Touch either the solid green line (PCE index) or the solid black line (CPI) that indicates the monthly
inflation percentage change from a year ago. Remember the Fed's target inflation rate is 2%.
NOTE: December 10, 2025: According to the Federal Reserve's most recent Summary of Economic
Projections from the December 10, 2025 meeting, the median forecast is that the 2% inflation rate
target will not be reached until the end of 2028.
| The Dual Mandate Bullseye Interactive Activity |
Over the years, the Federal Reserve Bank of Chicago has been publishing a Dual Mandate Bullseye.
Directions for the Dual Mandate graph created by Steven Reff are located below:
1. Click and drag the Bullseye along the purple bar to see how the Non-Cyclical Rate of Unemployment has
changed since 1977; click and drag the bullseye to the left to see the projected Non-Cyclical Rate of
Unemployment until 2031. When you are finished, drag the bullseye back to 4.5% unemployment rate.
If you want to make this lesson short, click on the "date" buttons (2013 through 2024) on the interactive
Dart Board below to see how the second Obama Administration performed, the first Trump Administration
performed, and the first Biden Administration performed. Many historians might say you cannot put the
blame or the praise on any single administration; however, that is what many voters do.
If you want to play this x and y game of darts, follow the directions below:
2. Click and drag the yellow dot located next to the date to the appropriate coordinates on the graph
relating to unemployment and inflation percentages (PCE index used to determine inflation).
3. After dragging one dot, click the blue Dart Year buttons to check your answers and when you are finished,
see how close the economy has come to reaching the Fed's Targeted Inflation Rate of 2% and the
2020 Non-Cyclical Rate of Unemployment of 4.5% (formerly entitled the Natural Rate of Unemployment).
IMPORTANT: Drag one dot on to the graph and click on the blue Dart Year button. Do this for each
individual year.
| The Dual Mandate Bullseye Fun Interactive Activity |
- - - - - - - - - - - - - - - - - - - - - - - - - - - - - - - - - - - - - - - - - - - - - - - - - - - - - - - - - - - - - - - - - -
- - - - - - - - - - - - - - - - - - - - - - - - - - - - - - - - - - - - - - - - - - - - - - - - - - - - - - - - - - - - - - - - - -
In this lesson on Federal Reserve System, you learned the following concepts:
*What is price stability?
*What is maximum employment?
*What is the Dual Mandate and what does it mean for the economy?
*What is price stability?
*What is maximum employment?
*What is the Dual Mandate and what does it mean for the economy?
- - - - - - - - - - - - - - - - - - - - - - - - - - - - - - - - - - - - - - - - - - - - - - - - - - - - - - - - - - - - - - - - - -
NOTE: As of August 27, 2020 the Board of Governors looks at a broad base of employment figures to
determine maximum employment (unemployment rate, job vacancies, labor force participation rate,
worker flows, wage growth, and other data).
From June 2025 - September 2025, inflation (according to the PCE index) has risen from 2.6% to 2.8%.
determine maximum employment (unemployment rate, job vacancies, labor force participation rate,
worker flows, wage growth, and other data).
From June 2025 - September 2025, inflation (according to the PCE index) has risen from 2.6% to 2.8%.
Click on the 3-minute Cleveland
Fed 100 YouTube video below.
Skip the commercial when you can.
Fed 100 YouTube video below.
Skip the commercial when you can.