Looking at the graph below you are shown a situation where there are "limited or scarce reserves" which ended
in 2008 when Quantitative Easing (2008 - 2014). Students don't have to know Quantitative Easing, but here is
my research on Q1, Q2, Operation Twist, Q3, and Q4 (2008 to 2017):
https://reffonomics.com/QuantitativeEasing2BRAeconomics2021.html
With Limited Reserves, this is what happens on the graph below:
Notice when you drag the S (supply of reserves) along the D (demand for reserves) inside the area of "limited
reserves," this drives the FFR down.
Notice, though, when you drag the S (supply of reserves) along the D (demand for reserves) inside the area of
"ample reserves" where the D is nearly perfectly elastic, the FFR remains relatively the same.
To see how changing the administered rates (DR (primary), IOR, and interest on ON RRP) in an Ample- Reserves Regime
so as to expand or contract the economy, press the Expansionary or Contractionary buttons to the left of the graph below.
Notice as the administered rates go up, this pulls the the FFR (the demand for reserves) up.
so as to expand or contract the economy, press the Expansionary or Contractionary buttons to the left of the graph below.
Notice as the administered rates go up, this pulls the the FFR (the demand for reserves) up.
| Fireside Chat 7 |
| MACRO -- Unit 4, Topics 4.6 Monetary Policy (Ample Reserves) |
| When did the FRB move from Limited Reserves to Ample Reserves? |
_______________Stop at this Line_________
| Limited to Ample Reserves Graph in its Entirety |
| Ample Reserves for the LONG RUN |
With Ample Reserves, this is what happens on the graph above:
Notice when you drag the S (supply of reserves) left and right along the D (demand for reserves or FFR)
inside the area of "Ample Reserves," this does not change the FFR.
Notice when you drag the S (supply of reserves) left and right along the D (demand for reserves or FFR)
inside the area of "Ample Reserves," this does not change the FFR.
- - - - - - - - - - - - - - - - - - - - - - - -
- - - - - - - - - - - - - - - - - - - - - - - -
| A Hopeful Future of The Ample Reserves Graph |
When the short-term rate (Effective Federal Funds Rate (FFR)) rises and falls, then long-term rates (such as the
Prime Lending Rate) have a propensity of moving in the same direction.
Prime Lending Rate) have a propensity of moving in the same direction.

| Steven M. Reff Economics Lecturer University of Arizona (2007 - 2016) The 2015 University of Arizona Five-Star Faculty Award |


Within the first 24 seconds, Jerome Powell, the Chairman of the
Federal Reserve, explains the difference between the Debt and
Deficit to Congressman John Kennedy from Louisana, and then
moves on to the most important discussion of money -- M2.
Federal Reserve, explains the difference between the Debt and
Deficit to Congressman John Kennedy from Louisana, and then
moves on to the most important discussion of money -- M2.
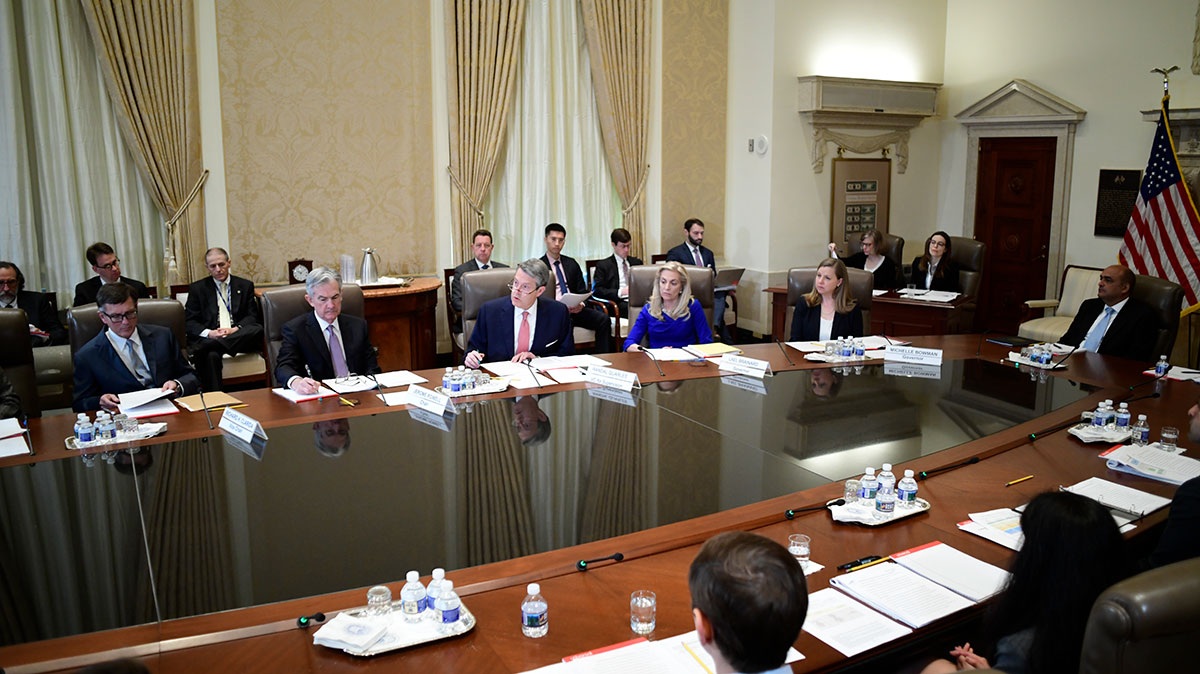
| February 2021 Senate Banking Committee on the Semiannual Monetary Policy Report |
“When you and I studied economics a million years ago M2 and monetary aggregates seemed to have a relationship to economic
growth,” Powell said, referring to one main measure of the money in public hands. “Right now ... M2 ... does not really have
important implications. It is something we have to unlearn I guess.” --Jerome Powell, FED Chair (February 23, 2021)--
growth,” Powell said, referring to one main measure of the money in public hands. “Right now ... M2 ... does not really have
important implications. It is something we have to unlearn I guess.” --Jerome Powell, FED Chair (February 23, 2021)--
You will NOT "need" to know that M2 is no
longer used as a leading indicator by the
Federal Reserve. What you will "NEED" to
know is a few items for the May Exam is:
Savings is now part of M1 as of April 2020.
Realize, though, that it is still a part of M2 as
M2 consists of M1 + money market accounts.
M2 used to be M1 + savings accounts and
money market accounts.
2022 CED
The maximum value of the money multiplier can be calculated as the reciprocal of the
required reserve ratio.
NOTE: March 26, 2020 the require reserve ratio was set a 0%.
This would make the simple money multiplier: 1/RR = 1/0 = Undefined.
The tools of monetary policy may include the central bank’s discount rate and other
administered interest rates (e.g., interest on reserves), open market operations, and the
required reserve ratio. The tools used and the way in which they are implemented differ
between economies that have limited reserves in their banking system and economies that
have ample reserves in their banking system. (The banking system in the United States has
ample reserves, and the Federal Reserve’s key policy tool is interest on reserves.)
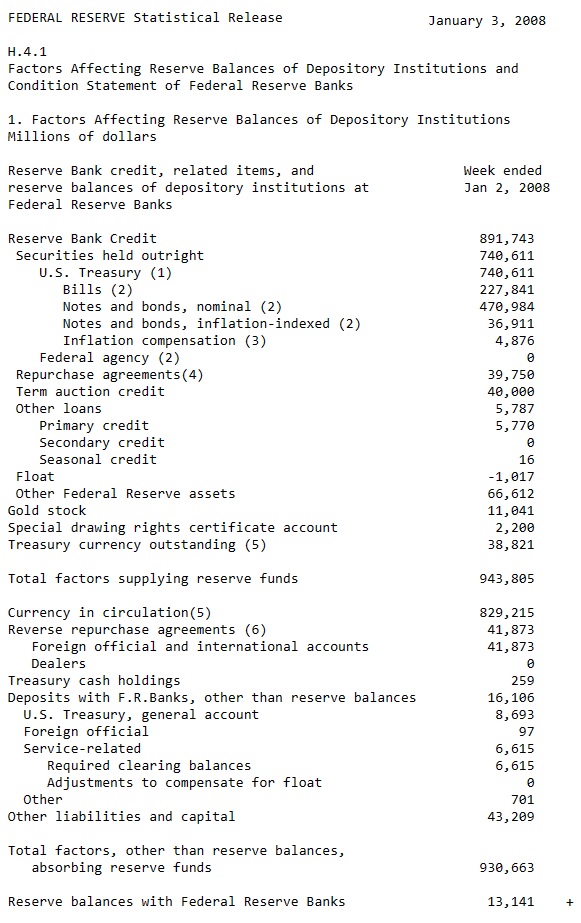

How the Financial Crisis of 2007-09 Changed Monetary Policy
Implementation
In response to economic and financial conditions in 2008, the Federal
Reserve lowered the FFR target to near zero. And, it also shifted from
setting a single FFR target to setting a FFR target range, with the upper
and lower limits on the range consistently 0.25 percentage points apart.
For example, starting in December 2008, the target range was set at 0 to
25 basis points (i.e., 0.0 percent to 0.25 percent). But even with that low
range, the economy still needed more stimulus.6 As a result, between 2008
and 2014 the Fed conducted a series of large-scale asset-purchase
programs to lower longer-term interest rates, ease broader financial
market conditions, and thus support economic activity and job creation.7
In particular, the Fed purchased a sizable amount of longer-term
securities issued by the U.S. government and issued or guaranteed by
government-sponsored agencies such as Fannie Mae or Freddie Mac.
These purchases not only increased the Fed's level of securities holdings
but also increased the total level of reserves in the banking system from
around $15 billion in 2007 to about $2.7 trillion in late 2014. At this point,
reserves were no longer limited but instead quite plentiful, or "ample."
(Use your cursor or finger on the FRED graph to the right to see these
numbers on the graph)
The Financial Crisis also resulted in the implementation of new monetary
policy tools. The most significant was IOR. Congress had given the Fed
authority to pay interest on reserves in 2006, with a start date of 2011. The
start date was pushed up to October 2008 so the Fed could use the tool
during the Financial Crisis.
In the graph above shows the demand and supply curves in the current
ample-reserves framework. The top of the demand curve is still
influenced by the Fed's discount rate. Now, however, the demand curve
turns flat near the Fed's new administered rates, which helps steer the
FFR into the FOMC's target range. The supply curve is such that it
intersects the demand curve where it is flat. With this "ample" level of
reserves, the Fed does not need to make daily open market operations to
purchase or sell securities, as it did in the limited-reserves framework to
hit the FFR target (because now small shifts of the supply curve have
little or no effect on the FFR rate ).
The primary tool for keeping the FFR in its target range and driving the
demand curve flat is the IOR rate.
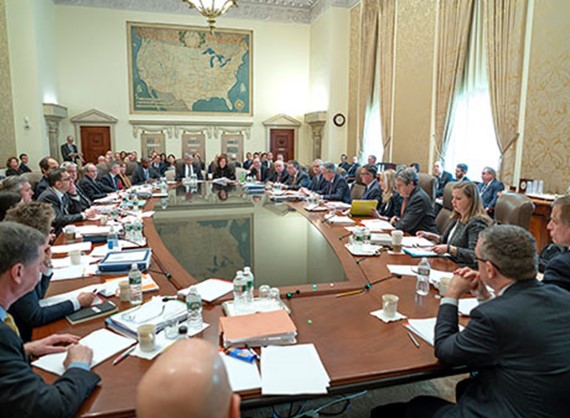
2023 Federal Open Market Committee (FOMC) Committee Members
• Jerome H. Powell, Board of Governors, Chair
• Michael S. Barr, Board of Governors
• Michelle W. Bowman, Board of Governors
• Lael Brainard, Board of Governors (resigned February 14)
• Lisa D. Cook, Board of Governors
• Philip N. Jefferson, Board of Governors
• Christopher J. Waller, Board of Governors
• John C. Williams, New York, Vice Chair
• James Bullard, St. Louis
• Susan M. Collins, Boston
• Esther L. George, Kansas City
• Loretta J. Mester, Cleveland
2023 Board of Governors of the Federal Reserve System (FRB)
• Jerome H. Powell, Board of Governors, Chair
• Michael S. Barr, Board of Governors, Vice Chair for Supervision
• Michelle W. Bowman, Board of Governors
• Lael Brainard, Board of Governors, Vice Chair
(resigned on February 14, 2023 to become the Director of the
National Economic Council at the White House)
• Lisa D. Cook, Board of Governors
• Philip N. Jefferson, Board of Governors
• Christopher J. Waller, Board of Governors
The maximum number of members who sit on the Federal Open
Market Committee (FOMC) consists of 12 members. Notice above
that the FOMC had this maximum number as of February 13:
7 members of the Board of Governors of the Federal Reserve
System as of February 13, 2023.
1 President of the Federal Reserve Bank of New York always
sits on the FOMC
4 of the remaining eleven Reserve Bank presidents, who serve
one-year terms on a rotating basis. (See district bank map below)
The maximum number of governors who sit on The Board of
Governors of the Federal Reserve is 7 governors.
Notice above as of February 13, 2023 the Board had the maximum
number.
The members of the Board of Governors of the Federal Reserve
System are nominated by the President and confirmed
by the Senate. A full term is 14 years.
The Chair and the Vice Chair of the Board, as well as the Vice
Chair for Supervision, are nominated by the President from among
the members and are confirmed by the Senate. They serve a term
of four years.
The interest rate on reserve balances (IORB rate) and the primary
credit rate (formerly known as the discount rate) are determined
by the FRB). IORB is the primary tool for the Federal Reserve's
monetary policy.
credit rate (formerly known as the discount rate) are determined
by the FRB). IORB is the primary tool for the Federal Reserve's
monetary policy.
| The Board of Governors meet every other Monday. |
| The Federal Open Market Committee (FOMC) that meets 8 times each year. Remember this Committee also includes the members of the Board of Governors. |
| October 2008 FED starts paying interest on required reserves and excess reserves. |
| The Money Supply Doesn't Matter Any More! |
| Reff's Final Notes: |
| Ample Reserves Regime Lesson, Part I |
Monetary Policy (Ample Reserves Regime, Part I):
https://reffonomics.com/firesidechat5arr.html
https://reffonomics.com/firesidechat5arr.html

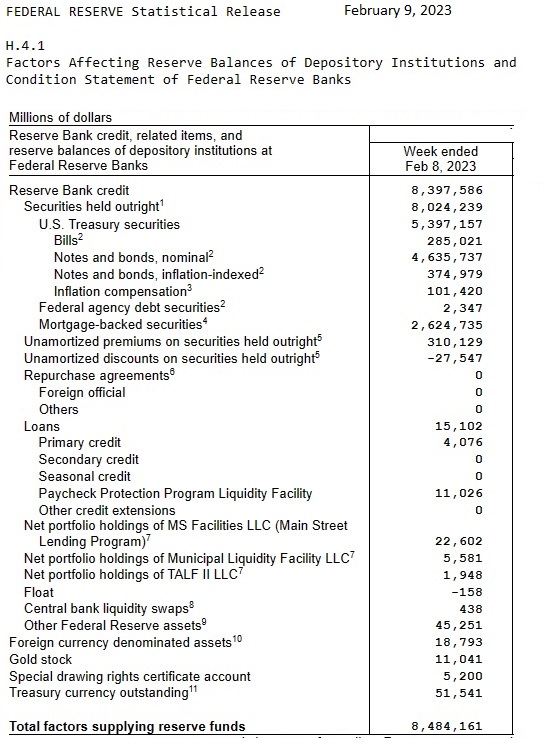
Ample Reserves Regime for the LONG RUN was OFFICIALLY announced in the
statement below on January 30, 2019 regarding Balance Sheet Normalization. This is the
balance sheet of the Federal Reserve and NOT the balance sheet of commerical banks.
statement below on January 30, 2019 regarding Balance Sheet Normalization. This is the
balance sheet of the Federal Reserve and NOT the balance sheet of commerical banks.
| Ample Reserves over the SHORT RUN |
Before it was officially announced in 2019 (forward guidance) that the LONG RUN
Monetary Policy is going to move forward in an Ample Reserves Regime, the FRB
was already implementing its primary tool of monetary policy of paying interest on
both required and excess reserves starting in 2008. Banks would hold their reserves
with the Federal Reserve rather than holding reserves inside the commercial banks.