- - - - - - - - - - - - - - - - - - - - - - - - - - - - - - - - - - - - - - - - - - - - - - - - - - - - - - - - - - - - - - - - - - -
*Definition of Supply (S)
*The Determinants of Supply
*The Shifts in Supply (increase or decrease)
*The Determinants of Supply
*The Shifts in Supply (increase or decrease)
A Change in Quantity Supplied
- - - - - - - - - - - - - - - - - - - - - - - - - - - - - - - - - - - - - - - - - - - - - - - - - - - - - - - - - - - - - - - - - -
The Determinants of Supply
A determinant is defined as a factor that affects the outcome of
something. In the lessons below you are going to see the determinants
that affect the supply curve, known as the determinants of supply.
As you recall the supply curve is described at a specified time, all
other things held constant (ceteris paribus). However, as you well
know, things are always changing and the supply curve is no different.
The determinants that affect supply are shown in their entirety below.
If any of these determinants change, then the supply curve changes.
The changes in the determinants either increases (a shift to the right) the
supply curve or decreases (a shifts to the left) the supply curve.
Review of what you have learned in the unit on The Law of Supply:
*Definition of Supply (S)
*The Determinants of Supply
*The Shifts in Supply (increase or decrease)
*The Determinants of Supply
*The Shifts in Supply (increase or decrease)
If there is a change in a Determinant of Supply,
then there will be a change in Supply.
Determinants of Supply:
1. Change in the # of suppliers
2. Change in costs (input)
3. Change in physical availability of resources
4. Change in technology (LR)
5. Change in expected incomes by suppliers
then there will be a change in Supply.
Determinants of Supply:
1. Change in the # of suppliers
2. Change in costs (input)
3. Change in physical availability of resources
4. Change in technology (LR)
5. Change in expected incomes by suppliers
Throughout the remainder of this eTextbook you must understand
that there is a HUGE difference between a change in QUANTITY
SUPPLIED (QS) and a change in SUPPLY (S). In the previous lesson
on QUANTITY SUPPLIED (Qs), you learned that there is only one
variable that changes QUANTITY SUPPLIED (Qs) and that is PRICE.
that there is a HUGE difference between a change in QUANTITY
SUPPLIED (QS) and a change in SUPPLY (S). In the previous lesson
on QUANTITY SUPPLIED (Qs), you learned that there is only one
variable that changes QUANTITY SUPPLIED (Qs) and that is PRICE.
A Change in Supply
Only one variable changes the
quantity supplied and that is
PRICE.
quantity supplied and that is
PRICE.
A change in Price
changes Qs.
changes Qs.
A change in Price does
NOT change Supply.
NOT change Supply.
- - - - - - - - - - - - - - - - - - - - - - - - - - - - - - - - - - - - - - - - - - - - - - - - - - - - - - - - - - - - - - - - - - -
(Take your cursor or finger and click and
drag the yellow dot that represents the P
up an down)
drag the yellow dot that represents the P
up an down)
(Take your cursor or finger and click and drag
the new demand curve (S1) to the right and to
the left and see what happens to P and Q.)
the new demand curve (S1) to the right and to
the left and see what happens to P and Q.)
1. Number of Suppliers
In this unit on the Law of Supply, you will learn about the following:
| Law of Supply |

| Steven M. Reff Economics Lecturer University of Arizona (2007 - 2016) The 2015 University of Arizona Five-Star Faculty Award |
- - - - - - - - - - - - - - - - - - - - - - - - - - - - - - - - - - - - - - - - - - - - - - - - - - - - - - - - - - - - - - - - - -
DETERMINANTS OF SUPPLY
2. Costs (Input)
3. Physical Availability of Resources
4. Technology (LR)
5. Expected Future Prices by Suppliers
IMPORTANT!! If you do NOT memorize these determinants
of supply, you will fail this course. Just like an actor who
must memorize his or her lines for a movie, you too must
memorize the Determinants of Supply.
of supply, you will fail this course. Just like an actor who
must memorize his or her lines for a movie, you too must
memorize the Determinants of Supply.
Test Your Knowledge #1
- - - - - - - - - - - - - - - - - - - - - - - - - - - - - - - - - - - - - - - - - - - - - - - - - - - - - - - - - - - - - - - - - -
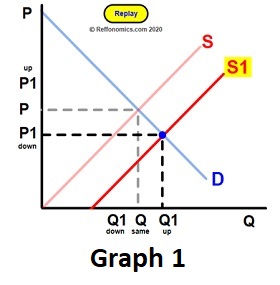
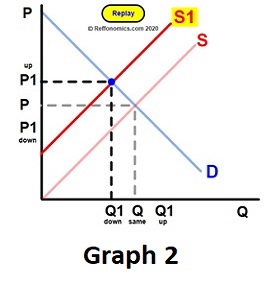
Below are two graphs:
Graph 1 indicates an increase in supply.
Graph 2 indicates a decrease in supply.
Underneath the graphs are the 5 determinants of supply that you
MUST MEMORIZE. The first set of graphs and table show an
INCREASE in Supply. The second set of graphs and table show a
DECREASE in Supply.
With your cursor or finger click on the correct answers on the table
below the two graphs.
Below are two lessons, each having a graph with buttons relating
to the determinants that either increase supply or decrease supply.
With your cursor or finger, click on each determinants to see a shift of
the supply curve on the graph.
to the determinants that either increase supply or decrease supply.
With your cursor or finger, click on each determinants to see a shift of
the supply curve on the graph.
Test Your Knowledge #2
- - - - - - - - - - - - - - - - - - - - - - - - - - - - - - - - - - - - - - - - - - - - - - - - - - - - - - - - - - - - - - - - - -
- - - - - - - - - - - - - - - - - - - - - - - - - - - - - - - - - - - - - - - - - - - - - - - - - - - - - - - - - - - - - - - - - -
Below is a graph where you can move the supply curve with your
cursor or finger. Underneath the graph are 10 questions with an answer
button relating to a shift in supply.
cursor or finger. Underneath the graph are 10 questions with an answer
button relating to a shift in supply.
Test Your Knowledge #3
- - - - - - - - - - - - - - - - - - - - - - - - - - - - - - - - - - - - - - - - - - - - - - - - - - - - - - - - - - - - - - - - - -
Determinants that Increase Supply
Determinants that Decrease Supply
In this lesson you will learn the Law of Supply and the determinants that change
(shift) the supply curve.
(shift) the supply curve.
- - - - - - - - - - - - - - - - - - - - - - - - - - - - - - - - - - - - - - - - - - - - - - - - - - - - - - - - - - - - - - - - - -
Scroll with your cursor or finger to see all 10 questions. After shifting the
supply curve, click on the answer. Reset the graph for each question.
supply curve, click on the answer. Reset the graph for each question.
Reffonomics.com 3 x 3 Videos (3-minute videos + 3 Multiple Choice Questions)
Quantity Supplied vs. Supply (2:16 minutes)
Determinants of Supply, Part I (2:49 minutes)
Determinants of Supply, Part I (2:49 minutes)
Lecture 6: Law of Supply (21:29 minutes)