| Perfect Competition, Part I |
 |
| PERFECT COMPETITION |
| A perfectly competitive market has many, many buyers and sellers. What is meant by "many, many" is thousands, if not millions, of buyers and sellers, where sellers sell identical products. There are truly no perfectly competitive markets in existence today, but the closest perfectly competitive market would be in agriculture. Most farmers' corn is close to being identical, but with the new hybrids of seed, some corn is differentiated from other types of corn. |
| Click on the short lesson below to see your first side-by-side graphs of a perfectly competitive firm and perfectly competitive industry. |
| Having just reading the lesson above, you should have learned: * the characteristics of a Perfectly Competitive Market (many buyers and sellers, price takers, homogeneous product, no barriers to entry, and perfect information). * the demand curve for a firm is perfectly elastic and labeled MR = D = AR = P * the individual firm's profit-maximizing output occurs where MR = MC. * the firm earns a profit when the P > ATC at the profit-maximizing quantity. |
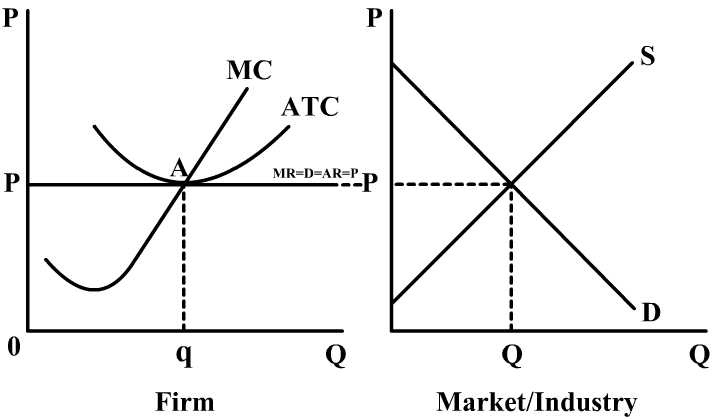
| The Firm and Industry in Long-Run Equilibirum |
| The graph to the right shows a firm and an industry in long-run equilibrium. Notice on the graph that in long-run equilibrium the TR = TC (TR = 0PAq; TC = 0PAq). This indicates in the long run economic profits are = to 0. |
| In the short-run, though, demand can increase causing the industry price and quantity to increase and the firm quantity and price to increase. Click on Play below: |
| Notice as demand increases in the industry/market, the industry price and quantity go up. Since the firm is a price taker and must take the market price, the individual firm's price rises. The firm's profit-maximizing output (optimal output) is where MR = MC, so as you can see in the graph above, the firm's output also goes up. |
| When you press replay above, you can see that Point C is the ATC of producing the profit-maximizing quantity (q1). Also, notice that Point C is above the lowest point on the ATC, and thus, the perfectly competitive firm is not productively efficient (the lowest point on the ATC). You also see that TR > than TC by the area of A P1 B C which is the economic profit for the individual firm. |
| Whenever economic profits are greater than zero (A P1 B C) indicating the firm (individual farmer) is earning an above normal rate of return, more entities (other farmers, corporate farms, individuals) will want to get into farming. So the economic profits encourage entry into the market, increasing supply in the industry/market, lowering the price and quantity in the industry. |
| Increase in Demand (The Firm and Industry in Short-Run Equilibirum) |
| In the short-run, though, demand can decrease causing the industry price and quantity to decrease and the firm quantity and price to decrease. Click on Play below: |
| Notice as demand decreases in the industry/market, the industry price and quantity go down. Since the firm is a price taker and must take the market price, the individual firm's price falls. The firm's profit-maximizing output (optimal output) is where MR = MC, so as you can see in the graph above, the firm's output also goes down. |
| When you press replay above, you can see that Point C is the ATC of producing the profit-maximizing quantity (q1). Also, notice that Point C is below the lowest point on the ATC, and thus, the perfectly competitive firm is not productively efficient (the lowest point on the ATC). You also see that TR < than TC by the area of P1 B D C which is the economic loss for the individual firm. |
| Whenever economic profit is less than zero (P1 A B C) indicating the firm (individual farmer) is earning a below normal rate of return, more entities (other farmers, corporate farms, individuals) will want to get out of farming. So the economic loss forces firms to exit the market, decreasing the supply in the industry/market, raising the price and lowering quantity in the industry. |
| Decrease in Demand (The Firm and Industry in Short-Run Equilibirum) |
 |
|
| In the long run, economic profit is always equal to 0. The reason this occurs is if firms are earning an economic profit in the short-run, entry into the market will occur reducing the short-run economic profits to a normal rate of return or where economic profit = 0. Similarly, if a firms are earning an economic loss in the short run, exit from the market will occur reducing the short-run economic losses to a normal rate of return or where economic profit = 0. |
| The graph above indicates the Firm and Market/Industry in long-run equilibirum where economic profit = 0. TR = the area of 0 P A q and the TC = the area of 0 P A q. |